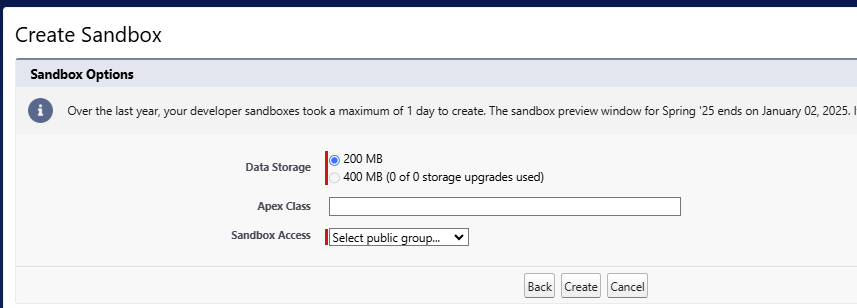
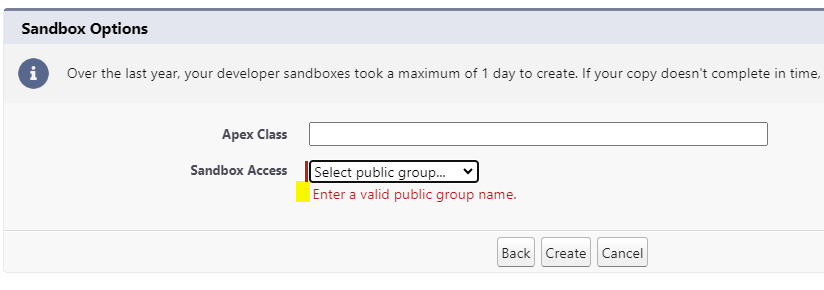
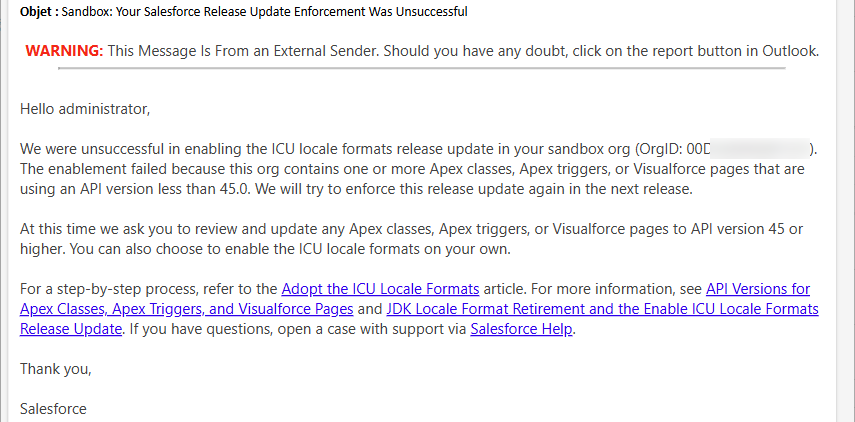
Maybe, have you received this communication from Salesforce after Spring’25 release update, either for your Production instance, or your non-preview sandboxes :
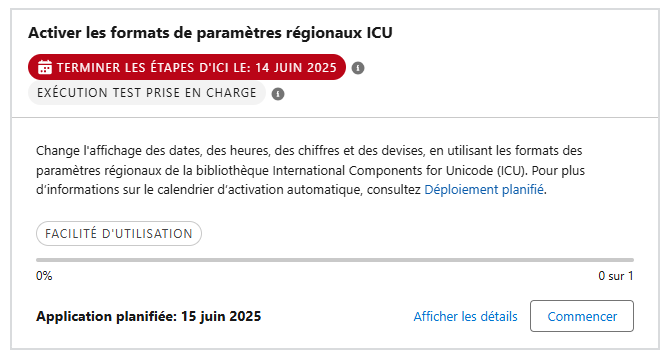
For Salesforce Spring’25 release update, ICU locale format was planned to be activated. I will explain how to prepare your Salesforce org for upcoming ICU format release update for Summer’25 if you have missed Spring’25 activation ?
But indeed, as mentioned in the documentations from Salesforce, you will find under this article, this upgrade from JDK previous format, towards ICU international format, was only possible if all technical (Apex, Visualforce, and Lightning) components of the platform were compliant (above API 45.0 version). If your Salesforce instance contains lower API versions of these components, Salesforce won’t enable ICU locale formats in your org, and indeed you should have received this email.
If ever you are concerned by the unsuccessful upgrade, and you received this email, please do not worry, and read the following article. There will be another ICU format activation slot, linked to next Summer’25 release upgrade (June 2025).
Introduction : What’s behind ICU Format ?
As an introduction, just to know what is behind the ICU letters, in this help article, Salesforce details the impacted locales / users, and the differences between both JDK and ICU formats for these locales :


A very straight-forward Action Plan, within just a few steps !
Assessment of your useR locales : Who will be impacted by ICU Update
From a pragmatic point of view, you need to tackle all technical actions, listed by Salesforce, to make sure the upgrade could pass next time. I suggest that you follow the procedure & query detailed by Salesforce in their exhaustive documentation (see below). You will find below a short version of it based on the actions I have followed on the instances I handle.
First, query your org to see your impacted users, and their locale. For information, Canada (en_CA locale) requires a specific activation to handle separately.
SELECT toLabel(LocaleSidKey) LocaleName, LocaleSidKey, Count(id) UserCount
FROM User where IsActive=true GROUP BY LocaleSidKey
ORDER BY Count(id) desc
You would be then able to visualize the way your date / values informations will be displayed (important, especially if you have some text manipulation of those data types).
Enable the ICU feature on a sandbox first
Go to Setup > Release updates, look for the ICU release update, click Get Started, and enable it. Do it first in a sandbox, and test that it does not generate regression errors in this sandbox ! Then apply on other sandboxes, testing instances and after that in Production.

Identify technical components to update to stick with ICU Release Update
As written above, if your instance contains technical components (Apex classes, apex triggers, Visualforce pages or components, Lightning components, managed packages), Salesforce asks you to upgrade their API version.
Always use as a target the Production version (target v62.0 for example, even when Preview sandboxes are in v.63.0 version) to prevent you from being blocked when deploying your updated components in Production.
To identify them, you may either leverage SOQL query on concerned Salesforce technical objects, or use a dedicated list view on each of these component types in Setup pages.
- a « Classes < v45.0 » view, for Apex classes (see the example below)
- a « Triggers < v45.0 » view, for Apex triggers
- a « VFP < v45.0 » view, for Visualforce pages
- a « VFC < v45.0 » view, for Visualforce components
- a « LWC < v45.0 » view, for Lightning components (Aura and LWC)

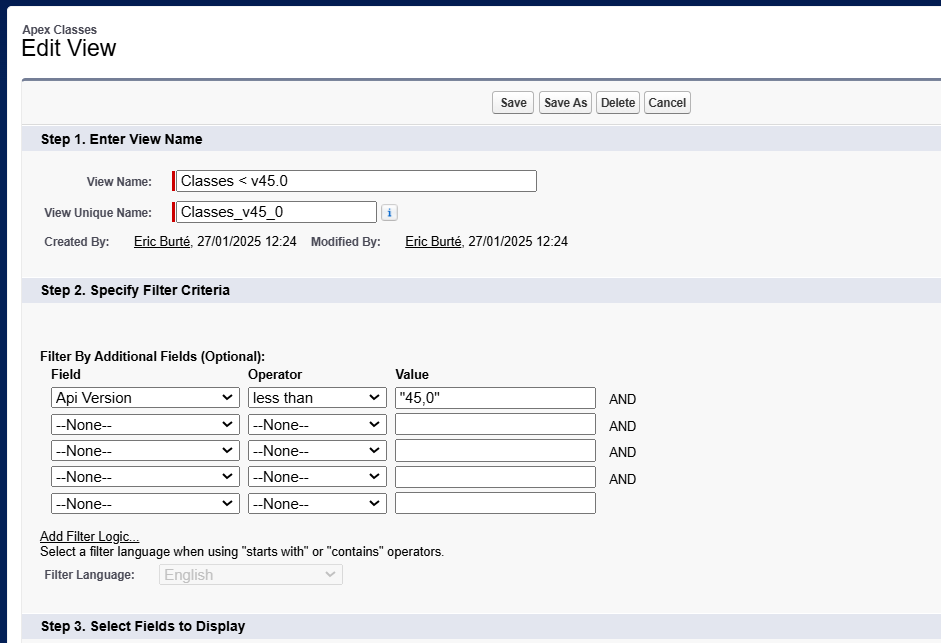
You may also query your instance (on ApexClass, ApexTrigger, ApexPage and ApexComponents objects) with Salesforce Inspector Reloaded, if more convenient for you.
SELECT Id, Name, ApiVersion, IsValid, NamespacePrefix
FROM ApexClass
WHERE ApiVersion < 45
ORDER BY ApiVersion DESC
Upgrade your code to a version compliant with ICU format
As written above, navigate through Setup, select the concerned components (for example « Apex Classes » for Apex classes) setup page, click on the metadata to update, Edit, access the « Salesforce.com API » version line, and update to target version.


If the component is compliant, the class will be updated within the correct version. Otherwise, you will be warned when saving, that there is an error in it, as you are when you are coding / saving in Dev Console / VS Code.
In this case, some changes would need to be undertaken while updating the code version of your components. For example, in API 59.0 version, the getSalesforceBaseUrl() method has been deprecated. So if your code includes a call to this method, you have 2 options :
- update this class to the latest / more recent compliant API version, where the method was available (v58.0 in this case) ; that could go faster for this time, but that is something that will need to be addressed sooner or later..
- take advantage of this overall « platform-related action plan », to include some refactoring technical actions / tickets to update the code (here, in this example, replace the method by a call to getOrgDomainUrl() available since v59.0)
Update your packages
- Update the unmanaged code to the latest Apex version, as you have done previously
- Update your managed packages (through AppExchange updates)
- If you use Salesforce related packages (Marketing Engagement / Pardot, Marketing Cloud Connector), Salesforce should enable this kind of features with their automatic release updates. As an admin, you still can update the package if nothing is available.
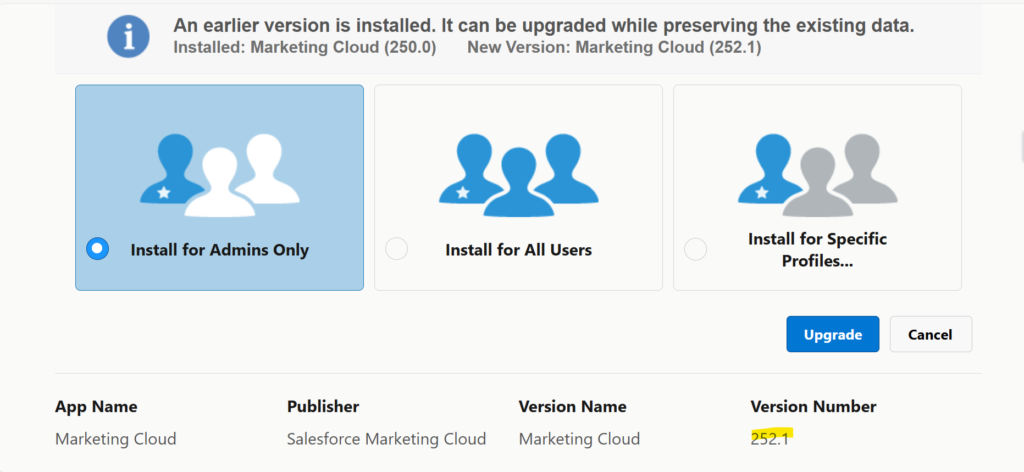
If you use 3rd-party-vendor’s managed packages (for CTI, for Org assessment, or for any feature improvement scenarios), you would necessarily need to look for package updates on AppExchange, or on the asset homepage / repository. Do not hesitate to contact the editor company if there is no update available.
Deployment in UAT for Non Regression testing, before Production
Deploy these technical elements before activation, in UAT for non-regression tests
- Code to be deployed / updated first
- Managed packages to be updated after, accordingly to the action plan you have set up for your test sandbox.
Once done and tested, deploy into Production, as soon as the tests on UAT are successful, and you will be ready for next ICU activation slot !
PS : If you have many teams working / deploying on Salesforce, do not forget to let them know about this action plan. They will need to be consistent concerning both coding / deployment / testing actions
To read more on the subject :
- Enable ICU (Release update) : https://help.salesforce.com/s/articleView?id=release-notes.rn_customization_globalization_enable_icu_locale_formats_release_update.htm&release=252&type=5
- Enable the ICU Locale Formats : https://help.salesforce.com/s/articleView?id=xcloud.icu_migration_enable.htm&type=5
- Adopt the ICU Locale Formats : https://help.salesforce.com/s/articleView?id=xcloud.icu_migration_how.htm&type=5
- Differences between Oracle JDK format, and ICU format: https://help.salesforce.com/s/articleView?id=xcloud.icu_migration_format_changes.htm&type=5
- ICU Locale Format Migration Tests : https://help.salesforce.com/s/articleView?id=xcloud.admin_locales_test_changes.htm&type=5

